Max Maths, Year 3, Learn together, Block graphs (2)
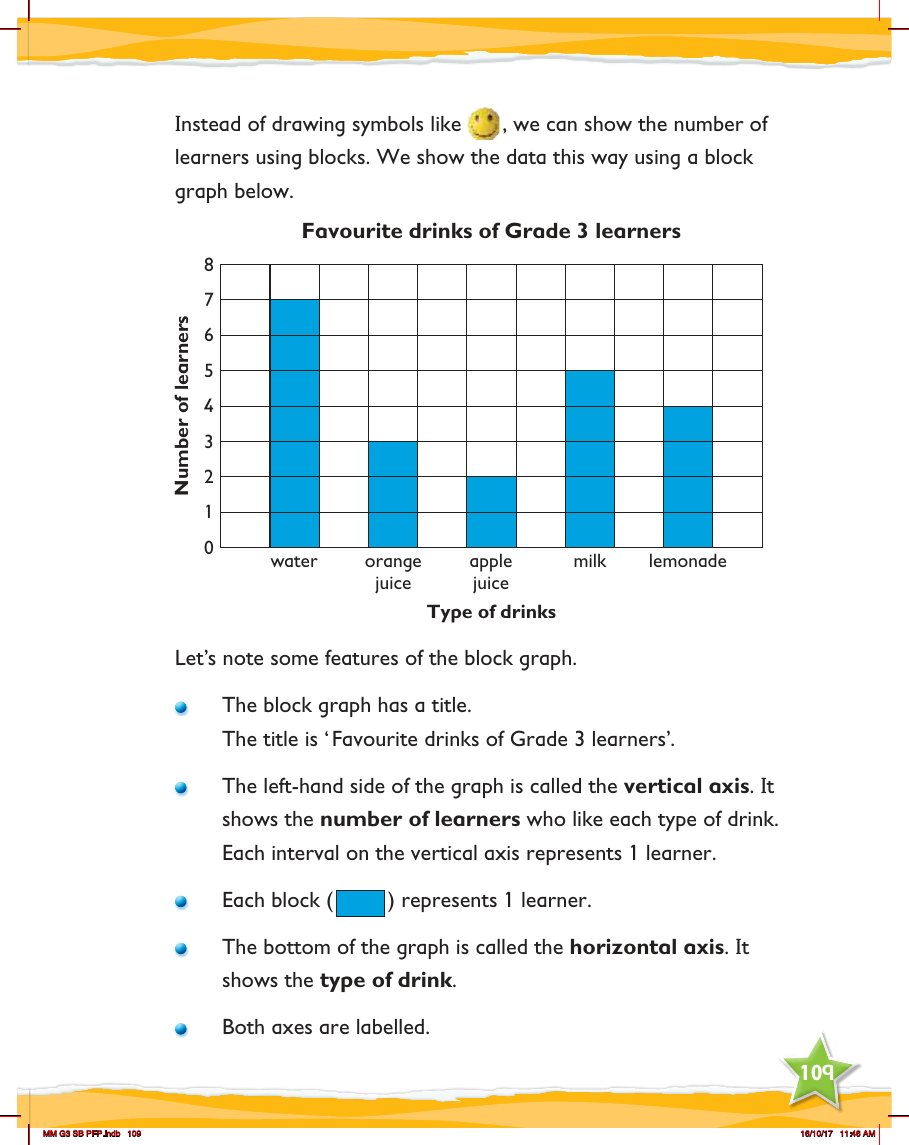

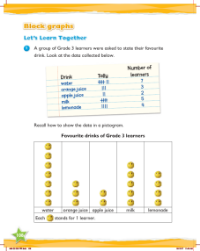
In the Max Maths curriculum for Year 3, students are introduced to block graphs as a way of representing data visually. A block graph is a simple tool that uses blocks to represent the number of items or, in this case, the preferences of learners. The example provided illustrates the favourite drinks of Grade 3 learners, with different beverages such as water, orange juice, apple juice, milk, and lemonade listed along the horizontal axis. Each drink category is associated with a stack of blocks that corresponds to the number of learners who favour that particular drink. This type of graph makes it easy for young students to compare quantities at a glance.
The block graph is carefully structured with two main components: the vertical and horizontal axes. The vertical axis, which runs up the left side of the graph, is labelled with numbers to indicate the count of learners. Each interval on this axis signifies one learner, and this is consistent across the graph for accurate comparison. The horizontal axis, running along the bottom, categorises the data by type of drink. Each block placed above the drink's name represents one learner's preference. The block graph is complete with a descriptive title, "Favourite drinks of Grade 3 learners", which clearly communicates the subject of the data being presented. Both axes are clearly labelled, ensuring that the information can be easily understood and interpreted by the students.