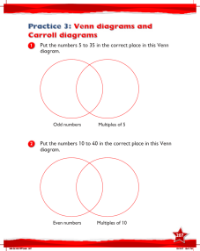
Max Maths, Year 2, Try it, Venn diagrams and Carroll diagrams (2)
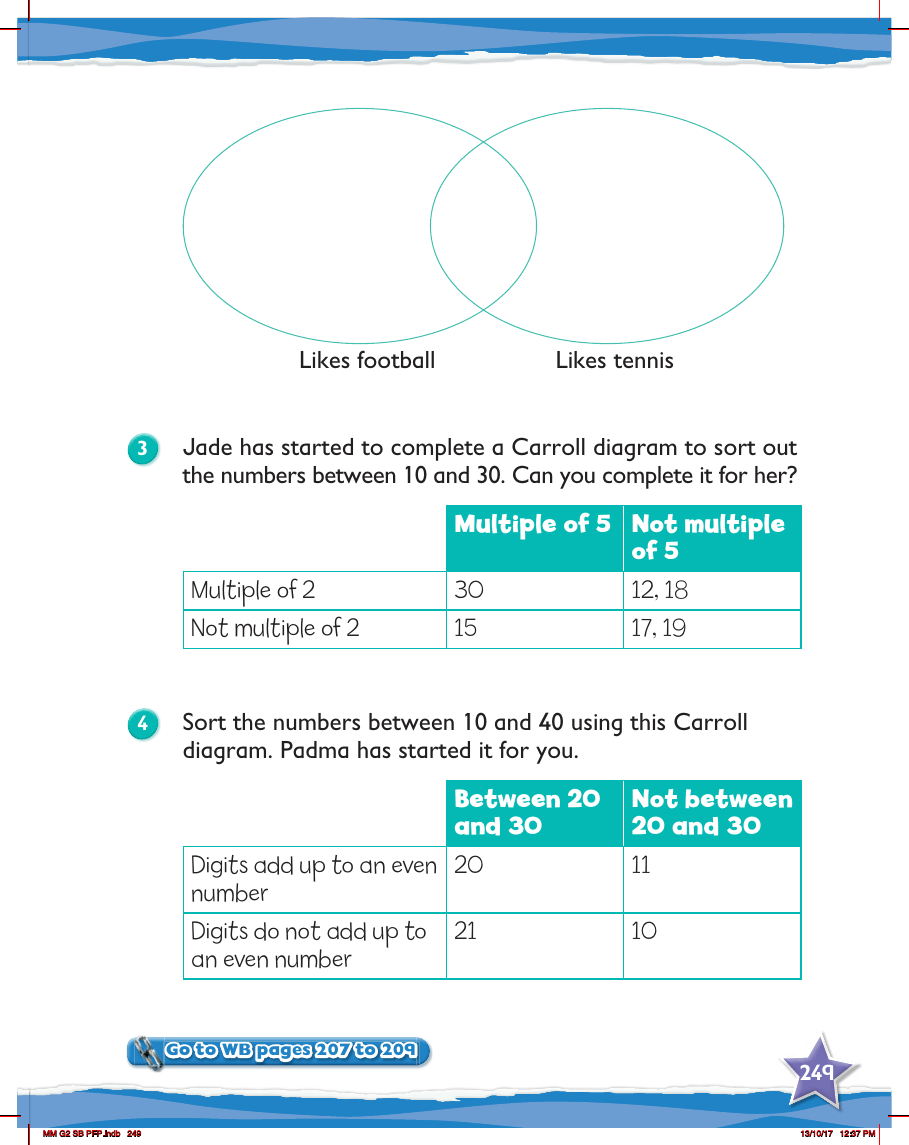

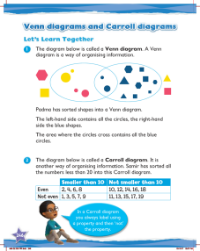
In a Year 2 mathematics lesson from Max Maths, students are introduced to the concept of sorting data using Venn and Carroll diagrams. One of the exercises focuses on categorising numbers between 10 and 30 based on whether they are multiples of 5 and/or multiples of 2. Jade has partially filled in a Carroll diagram, and the task for the students is to complete it. The diagram is divided into four quadrants, with the top row for multiples of 2 and the bottom row for numbers that are not multiples of 2. Similarly, the left column is for multiples of 5, and the right column is for numbers that are not multiples of 5. Students must place the remaining numbers in the correct quadrants, reinforcing their understanding of multiples and number properties.
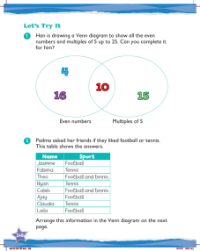
The second activity involves sorting numbers between 10 and 40 using another Carroll diagram. This time, the criteria are whether the numbers are between 20 and 30, and whether the digits of each number add up to an even number. Padma has made a start by placing the number 20 in the 'Between 20 and 30' and 'Digits add up to an even number' section, and the number 11 in the 'Not between 20 and 30' and 'Digits add up to an even number' section. The number 21 has been placed in the 'Digits do not add up to an even number' section, and the number 10 in the 'Not between 20 and 30' section. Students are tasked with continuing this pattern, sorting the remaining numbers accordingly. These exercises help students to develop logical thinking and number sense, as well as familiarise them with the use of diagrams to organise information.