Max Maths, Year 2, Learn together, Venn diagrams and Carroll diagrams (1)
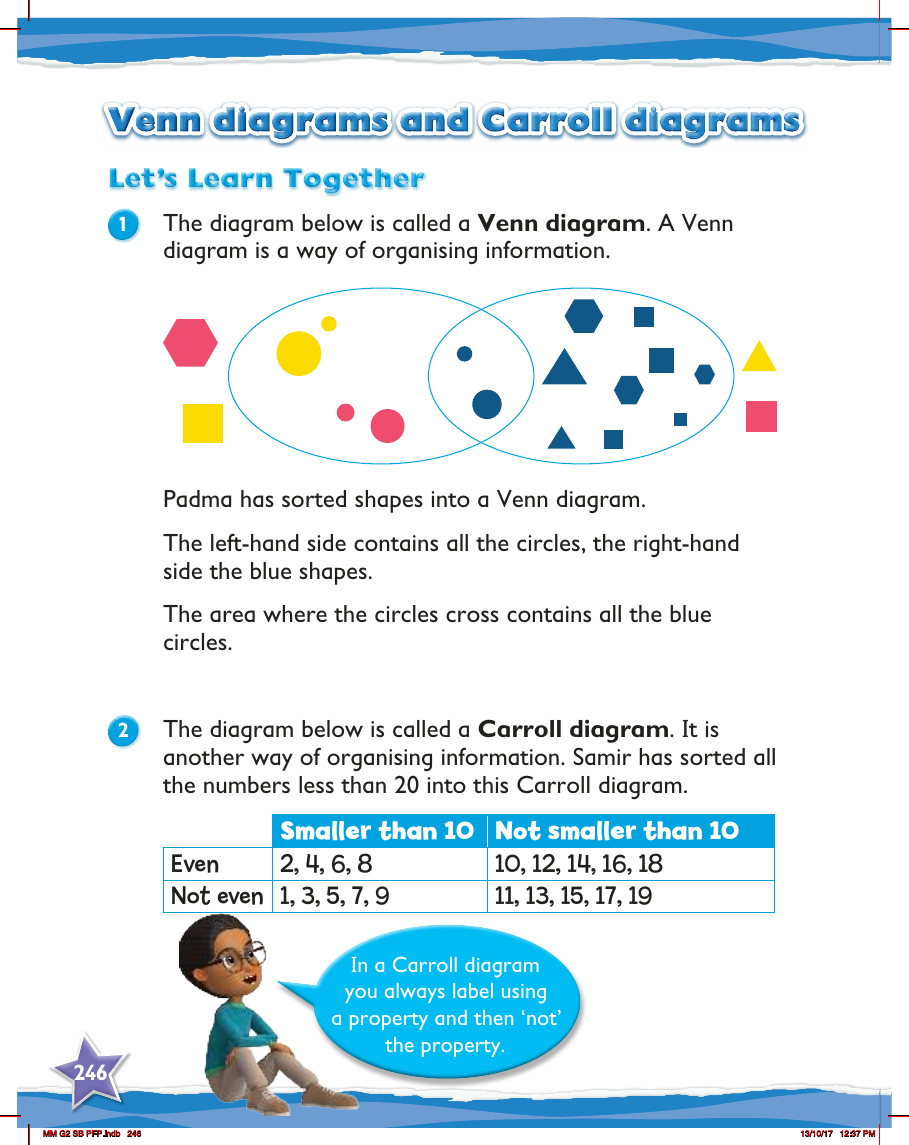

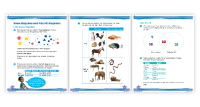
Venn diagrams and Carroll diagrams are two visual tools used to categorise and organise information, making it easier to understand and analyse. A Venn diagram consists of overlapping circles, where each circle represents a group of items with a common property. For instance, in the example provided, Padma uses a Venn diagram to sort shapes based on two characteristics: shape and colour. One circle contains all the circles, while another encompasses all the blue shapes. The intersection, where the circles overlap, represents items that share both properties—in this case, all the blue circles.
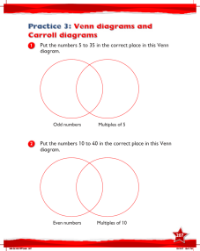
On the other hand, a Carroll diagram is a grid that allows for classification based on two dichotomous properties. Samir has used a Carroll diagram to sort numbers less than 20. The diagram is divided into four sections, with labels indicating whether numbers are 'Smaller than 10' or 'Not smaller than 10', and 'Even' or 'Not even'. This results in a clear representation of where each number fits based on these two criteria. For example, the number 2 is placed in the section for numbers that are both smaller than 10 and even. Carroll diagrams are particularly useful because they encourage the use of logical thinking by categorising items as either possessing a certain property or not.