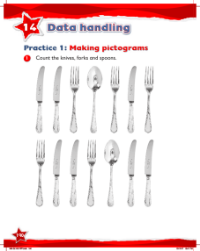
Max Maths, Year 2, Try it, Making pictograms (4)
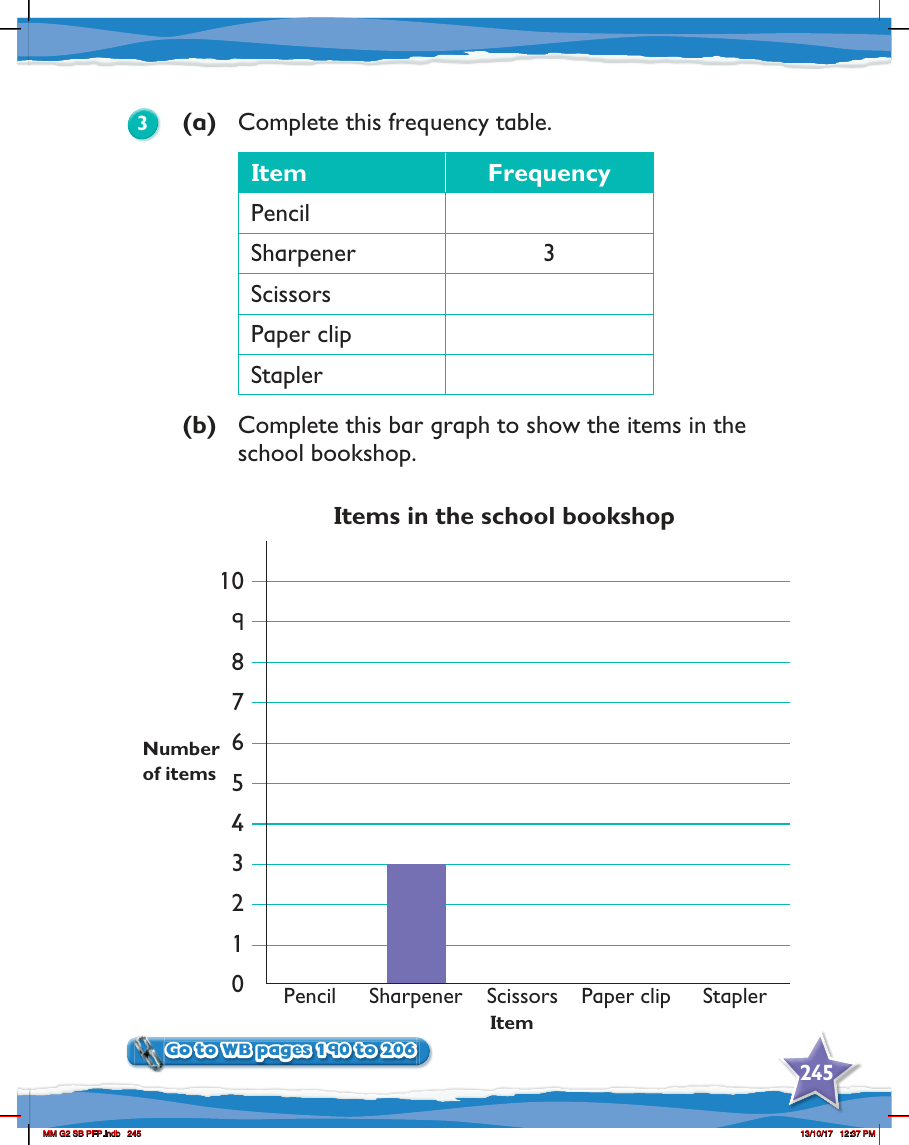

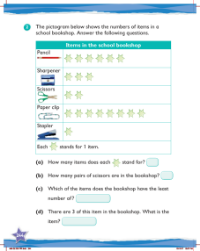
Max Maths for Year 2 introduces students to the basics of data handling through a practical exercise on making pictograms. In part (a) of the exercise, children are asked to complete a frequency table. The table lists various items typically found in a school bookshop, such as pencils, sharpeners, scissors, paper clips, and staplers. The frequency of each item is noted, with the sharpener already recorded as having a frequency of 3. Students must fill in the remaining frequencies, which requires them to count the number of each item and record their findings in the table.
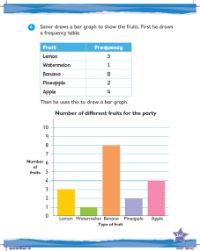
Part (b) of the exercise challenges students to represent the data from the frequency table in the form of a bar graph. The graph is designed with a vertical axis representing the number of items, ranging from 0 to 10, and a horizontal axis listing the items found in the school bookshop. The students must draw bars corresponding to the frequency of each item, thereby visualising the data. This activity not only helps students understand how to organise and present data, but also allows them to interpret information displayed in a bar graph format. The corresponding workbook pages provide additional examples and practice opportunities to reinforce the skills learned in this exercise.