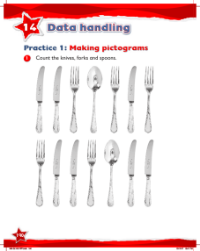
Max Maths, Year 2, Learn together, Making pictograms (3)
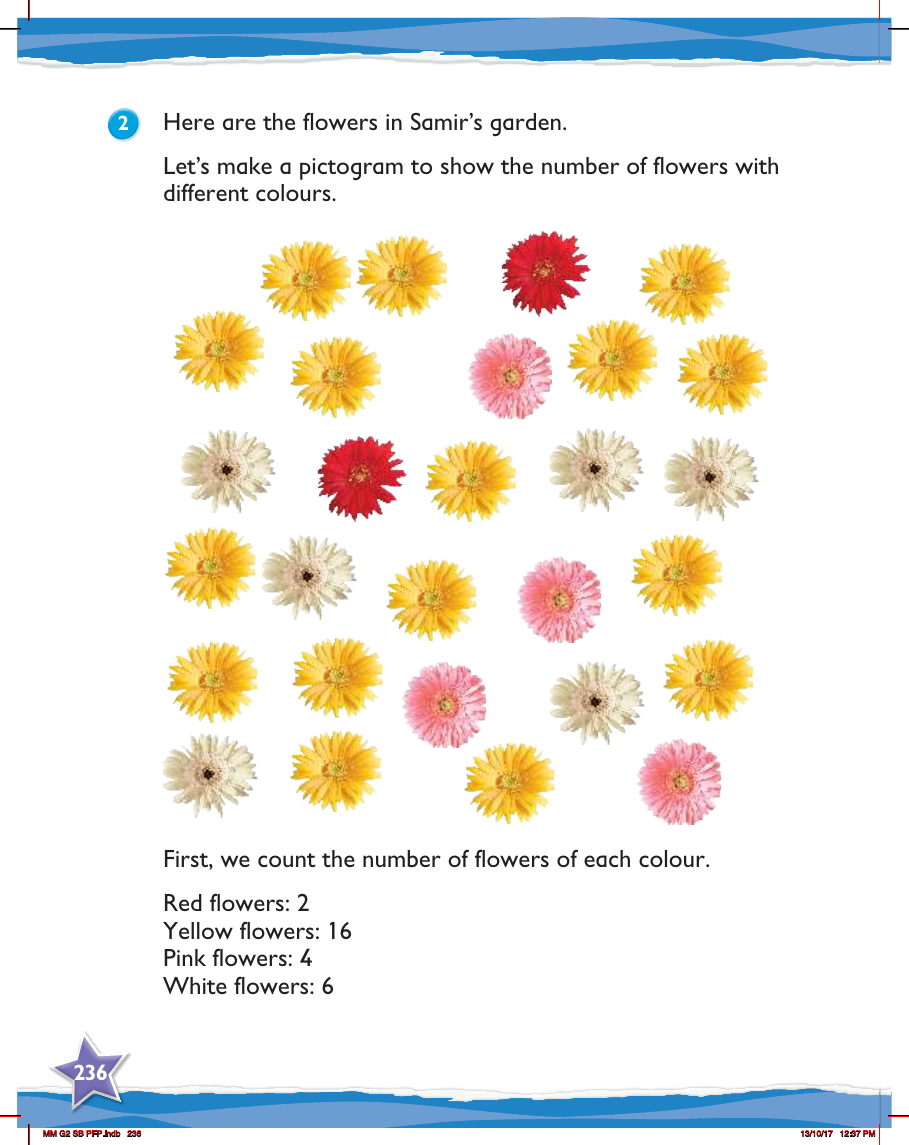

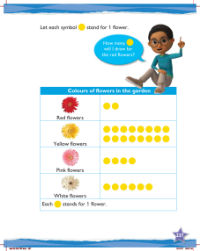
In a Year 2 mathematics lesson from Max Maths, children are invited to explore the concept of data representation through the creation of pictograms. The example provided for the lesson involves categorising and displaying the various flowers in Samir's garden according to their colours. To begin, students are asked to count the number of flowers of each colour, which are recorded as follows: there are 2 red flowers, 16 yellow flowers, 4 pink flowers, and 6 white flowers. This simple data collection serves as the foundation for the next step in the lesson.
With the counts in hand, the next task for the students is to represent this information visually by constructing a pictogram. A pictogram is a chart in which icons or symbols are used to illustrate data counts, with each icon typically representing one or more units. In this activity, the children will use appropriate symbols or pictures to represent the different coloured flowers and their quantities. This engaging and hands-on approach helps to solidify their understanding of basic data representation and allows them to see the visual differences in quantities, making comparisons between the groups of flowers based on colour both fun and educational.