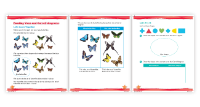
Max Maths, Year 1, Learn together, Reading Venn and Carroll diagrams
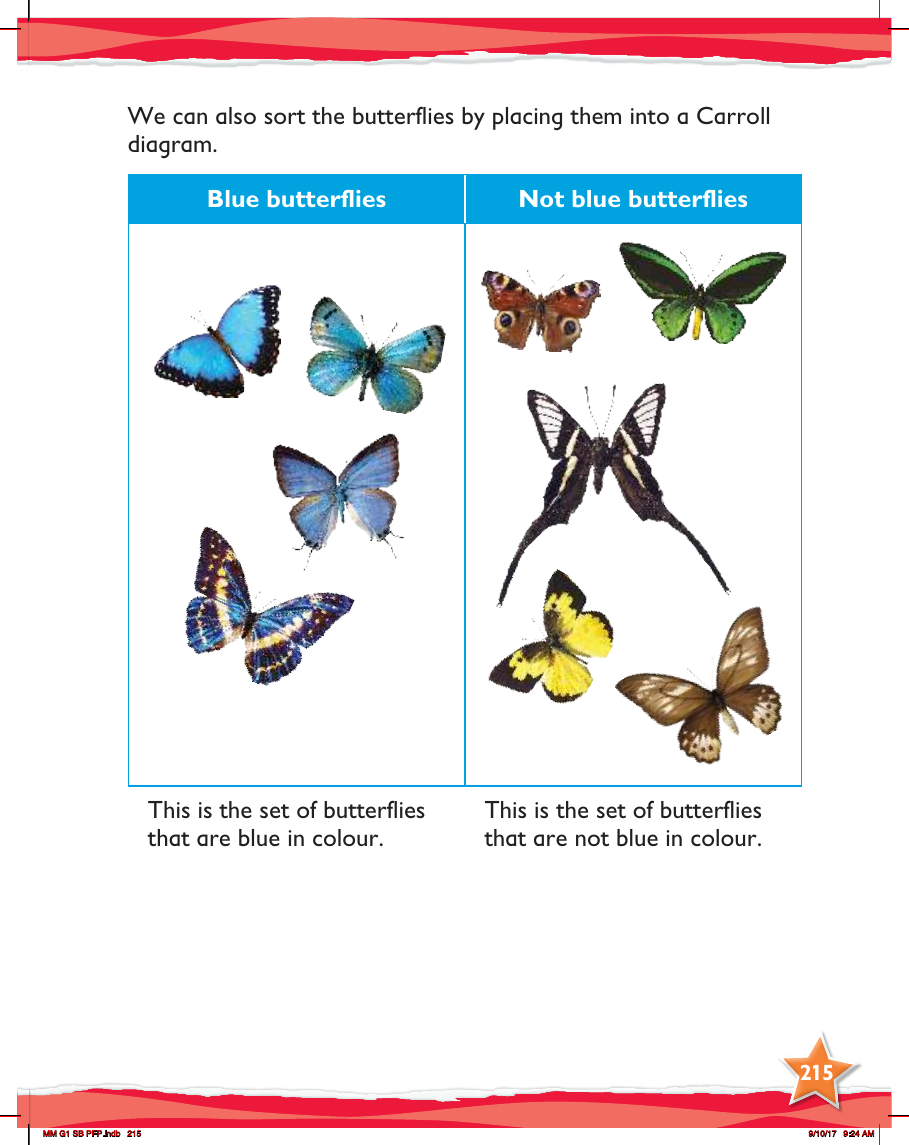

In the Max Maths programme for Year 1, students are introduced to the concept of sorting and categorising data using Venn and Carroll diagrams. The Carroll diagram is a simple chart that helps children to classify objects or items based on distinct attributes. In this particular activity, students learn to sort butterflies based on their colour.
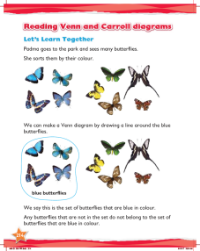
The Carroll diagram is divided into two categories: 'Blue butterflies' and 'Not blue butterflies'. The first category includes all the butterflies that are blue. This visual representation allows children to easily identify and group all the blue butterflies together. The second category contains the butterflies that do not have blue as their colour, helping children to understand that sorting involves separating items into different sets based on specific criteria. Through this exercise, students enhance their ability to observe and categorise, which are fundamental skills in data handling and mathematics.