Pictograms Statistics - Worksheet
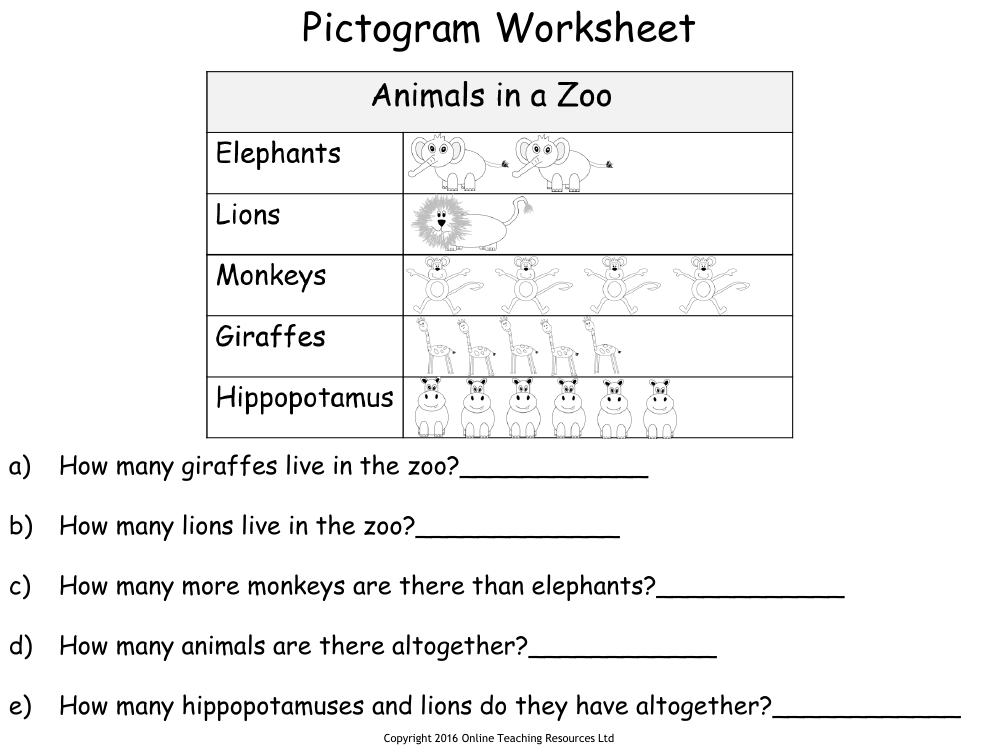
The Pictogram Worksheet is an educational tool designed to help students interpret and analyze data presented in the form of pictograms. In the first worksheet, students are tasked with questions about the population of animals in a zoo. They must determine the number of giraffes, lions, and other animals by reading the pictogram and perform simple calculations, such as finding the difference in numbers between monkeys and elephants, as well as totaling the number of animals in the zoo. The worksheet also asks students to combine the numbers of hippopotamuses and lions to find their collective total.
The second worksheet, titled 'Drawing a Simple Pictogram Worksheet,' encourages students to create their own pictogram based on data collected by a student named Rena, who surveyed her classmates about their favourite fruits. The task involves representing the number of votes for each fruit—apples, bananas, strawberries, oranges, and watermelon—visually in a pictogram. Students are then prompted to analyze their pictogram to identify the most and least popular fruits, calculate the total number of classmates surveyed, and determine the difference in popularity between bananas and strawberries. Additionally, there is another pictogram exercise related to hair colours, where students must read the pictogram to find out how many people have different hair colours, identify the most and least common hair colours, and then create their own pictogram representing the hair colours of their classmates, complete with a key they design themselves.