Block Diagrams Statistics - Worksheet
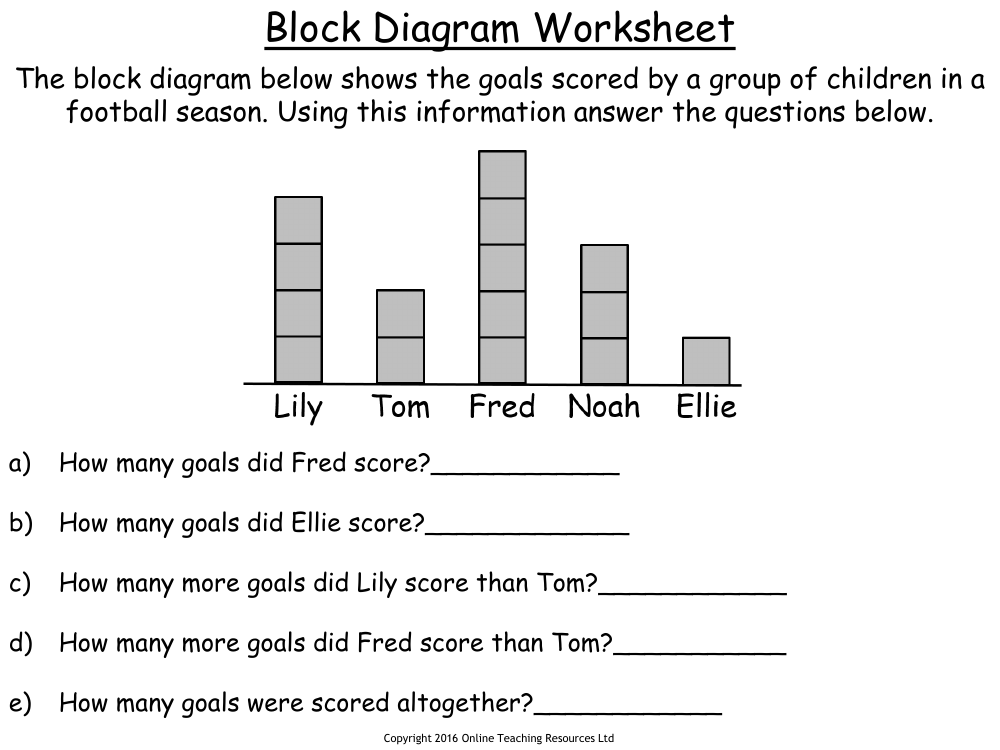
This worksheet is designed to introduce students to the concept of block diagrams, a visual tool used in statistics to represent data. The first section of the worksheet focuses on football, where students are required to interpret a block diagram that illustrates the number of goals scored by different children during a football season. The questions aim to assess the student's ability to read and extract information from the diagram, such as identifying individual scores, comparing the number of goals scored by different children, and calculating the total number of goals scored by the group.
The second part of the worksheet encourages students to create their own block diagram based on a survey conducted by a student named Imran, who has gathered data on his classmates' favourite crisp flavours. The worksheet provides the numbers for each flavour, and students must draw a block diagram using this information. After completing their diagrams, students will answer questions to determine the most and least popular flavours, compare the popularity of different flavours, and tally the total number of classmates surveyed. This exercise helps students to develop skills in data representation and analysis through the creation and interpretation of block diagrams.