Block Diagrams Statistics - PowerPoint
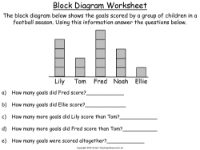
In a Year 2 mathematics lesson on statistics, students are introduced to the concept of block diagrams as a visual tool for representing numerical data. Block diagrams use blocks to signify individual units, making it easy for young learners to understand and interpret data. For example, in the context of a football season, each block on the diagram could represent a goal scored by a child. The lesson includes a practical exercise where students are provided with a block diagram that displays the number of goals scored by a group of children, and they are tasked with answering questions based on this information. Through these questions, students practice skills such as comparing quantities and performing simple addition to determine the total number of goals scored.
Further activities extend the learning by encouraging students to draw their own block diagrams. One worksheet prompts them to survey their classmates about their favourite crisp flavours and then represent the collected data using a block diagram. This aids in visualising which flavour is the most and least popular, as well as comparing the popularity of different flavours. Additional questions challenge the students to analyse the diagram by calculating differences and totals. This hands-on approach not only enhances their understanding of block diagrams but also reinforces basic statistical concepts and data interpretation skills in a fun and engaging manner.