Max Maths, Year 6, Work Book, Review of pictograms, block graphs, bar graphs and line graphs (3)
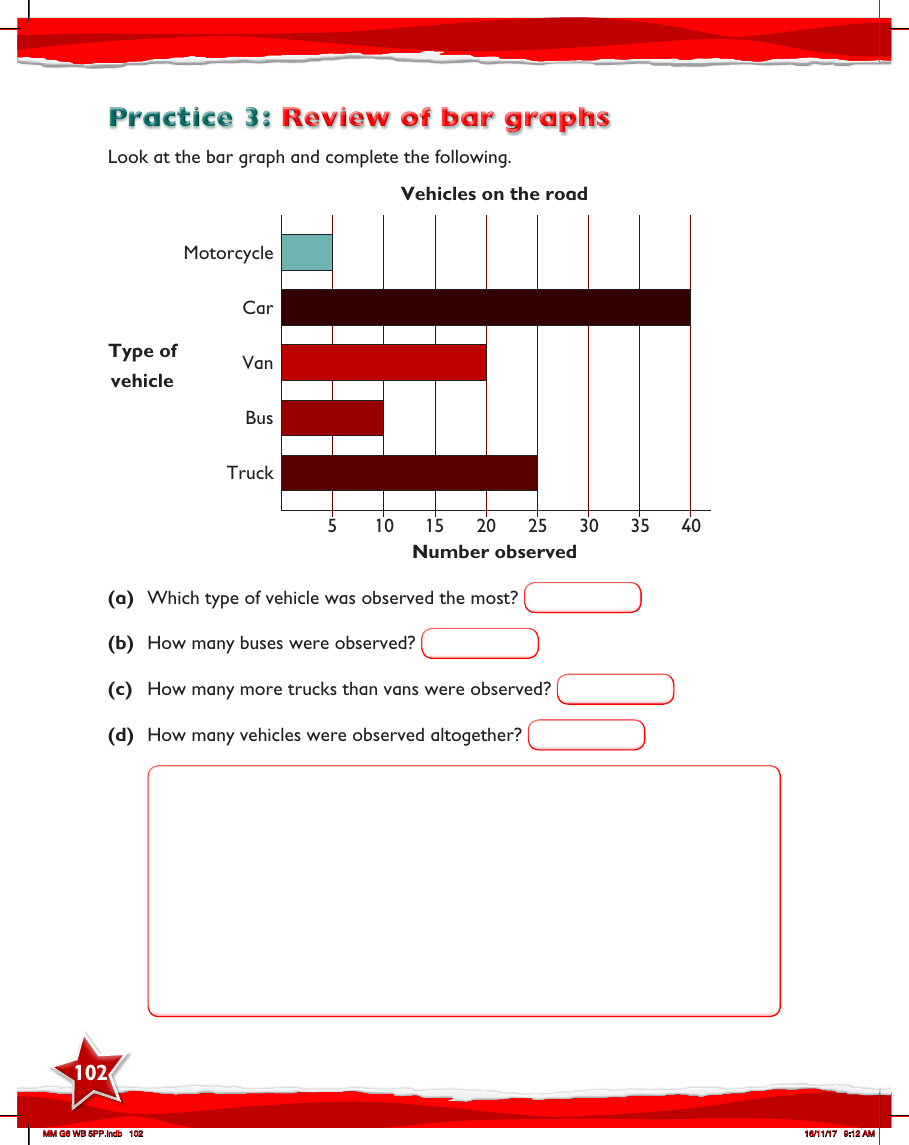

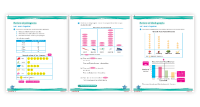
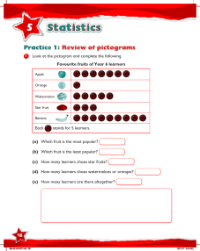
In the Max Maths Year 6 Workbook, students are provided with a comprehensive review of data representation, focusing on the interpretation of bar graphs in Practice 3. This particular exercise requires pupils to analyse a bar graph that displays the number of different types of vehicles observed on the road. The vehicles listed include motorcycles, cars, vans, buses, and trucks, with their corresponding frequencies presented on the graph. The task is to extract specific information from this visual data.
Students are asked a series of questions to test their understanding of the bar graph. Question (a) probes which type of vehicle was seen the most, requiring the student to identify the tallest bar. For question (b), they must determine the number of buses recorded by looking at the bar associated with buses. The third question, (c), challenges students to calculate the difference in the number observed between trucks and vans. Finally, question (d) asks for the total number of vehicles observed, necessitating a sum of all the quantities represented on the graph. Through these questions, students practice critical data interpretation skills, reinforcing their ability to analyse and draw conclusions from bar graphs.