Max Maths, Year 6, Learn together, Review of pictograms, block graphs, bar graphs and line graphs (5)
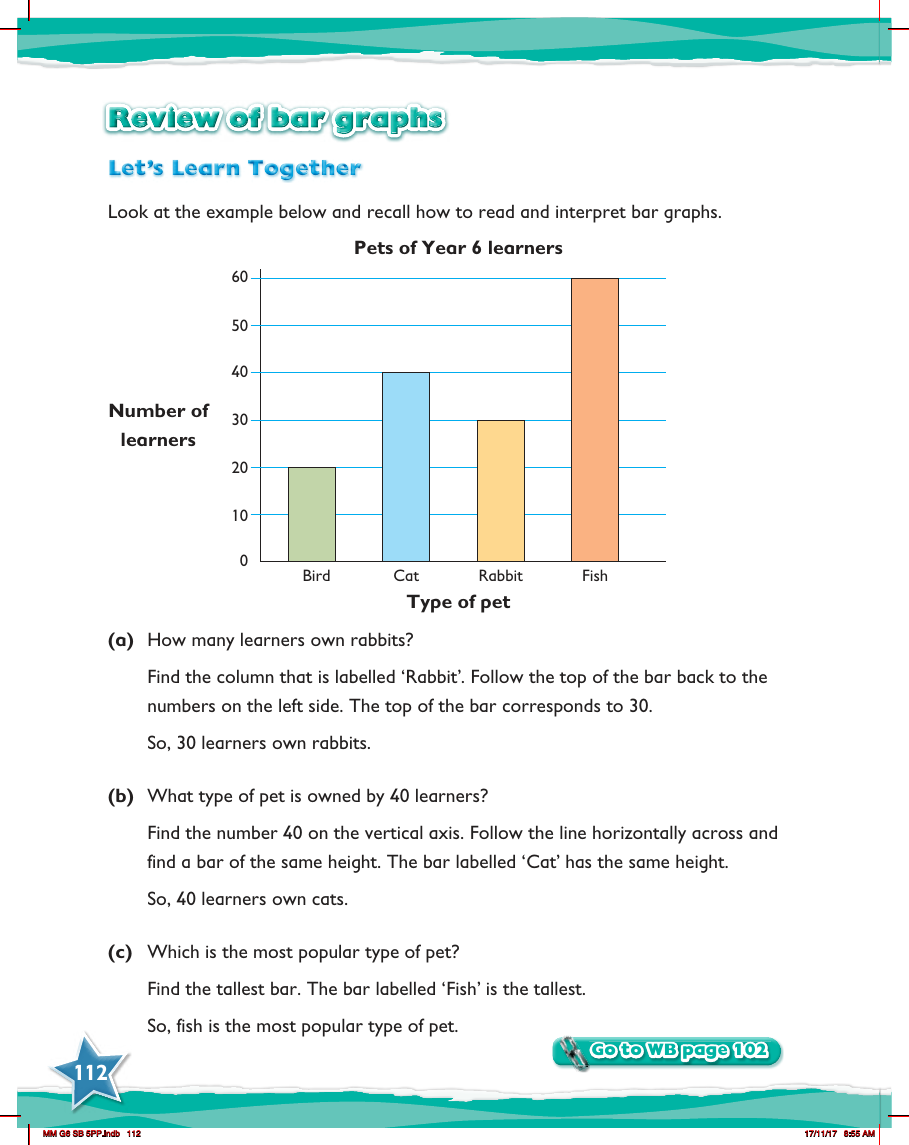

In a Year 6 maths lesson, students revisit the topic of bar graphs and how to interpret them. They are presented with an example that illustrates the types of pets owned by Year 6 learners. The graph includes various pets such as birds, cats, rabbits, and fish, with the number of learners owning each type of pet plotted on the vertical axis. To determine the number of learners with rabbits, for instance, students locate the 'Rabbit' column and trace the top of the bar to the corresponding number on the left side, which indicates that 30 learners have rabbits as pets.
Further exercises involve identifying which pet is owned by a specific number of learners. For example, to find out which pet is owned by 40 learners, students look for the number 40 on the vertical axis and then trace across to find a bar that matches this height. In this case, the 'Cat' bar aligns with the number 40, revealing that 40 learners own cats. Additionally, the lesson includes comparing the heights of the bars to determine the most popular pet. The tallest bar corresponds to 'Fish', indicating that fish are the most popular pets among the Year 6 learners. This activity not only reinforces how to read bar graphs but also encourages comparison and analysis of the data presented.