Statistics - Assessment
Maths Resource Description
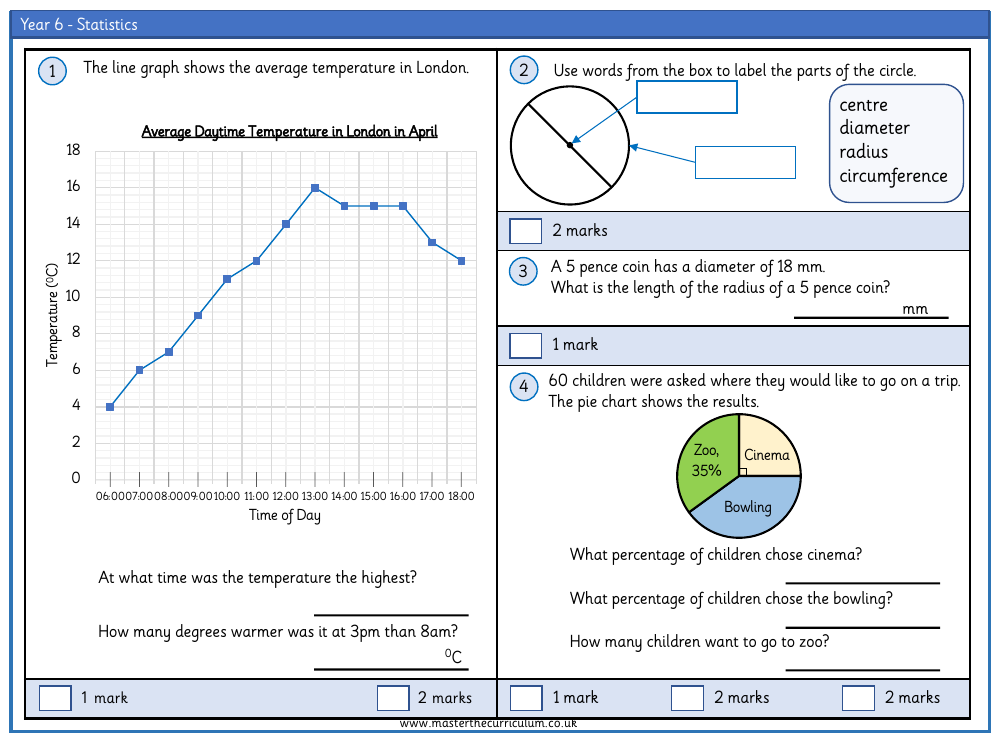
The provided text outlines a series of statistical tasks suitable for Year 6 students, focusing on interpreting and creating various graphs and charts. Students are asked to label parts of a circle using given vocabulary, such as 'centre', 'diameter', 'radius', and 'circumference'. They then move on to analyse a line graph showing the average daytime temperature in London and answer questions about temperature differences at specific times. In another task, they use a pie chart to determine the percentage of children who prefer different activities, such as visiting the zoo or going bowling. Additionally, they calculate the radius of a 5 pence coin given its diameter and represent data on the favourite pizza toppings of 90 people in a pie chart, demonstrating their ability to convert numbers into degrees for each chart segment.
The exercises also include tasks that require students to work with mean averages, such as calculating the average number of glasses of water consumed by Esin over a week. This is followed by a question on how many additional glasses were drunk in the subsequent week based on a new mean. Furthermore, students are presented with data on the price increase of a chocolate bar from 1995 to 2020 and instructed to draw a line graph to represent this information. These activities are designed to build statistical confidence, as reflected in a self-assessment prompt where students can rate their confidence level with statistics on a scale of one to five. The tasks aim to enhance students' proficiency in interpreting data, understanding percentages, and working with averages, while also developing their skills in creating accurate graphs and charts.