Statistics - Read and interpret line graphs - Presentation
Maths Resource Description
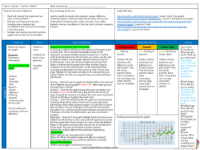
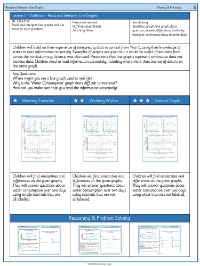
In a series of educational presentations, students are introduced to the concept of reading and interpreting line graphs, an essential aspect of the statistics curriculum for Year 6. The lessons begin with a discussion on where line graphs are commonly seen and the types of data they represent. Students are encouraged to consider the application of line graphs in real-life scenarios, such as tracking temperature changes over time or monitoring daily water consumption. The presentations include various activities where students compare different line graphs, noting similarities and differences, and use the graphs to answer specific questions about data points and trends. For example, they might analyze a graph showing water consumption at different times of the day and determine when the same amount of water was consumed or compare consumption across different days.
Further activities engage students in critical thinking by asking them to identify and correct mistakes in recorded data from the graphs, such as the height of a plant on a certain date or its growth over a period of time. Students also have the opportunity to create narratives and questions based on given graphs, which depict scenarios like a car's changing speeds, a person's elevation during a hike, or temperature fluctuations in an oven. These exercises aim to develop their analytical skills and understanding of how graphs translate into real-world situations. Independent work tasks challenge students to find errors, write correct interpretations of the data, and craft stories that illustrate the information presented in various line graphs. Discussions prompt students to reflect on the challenges of interpreting more complex graphs and share strategies for accurately reading and understanding the presented data.
