Statistics - Comparison, Sum and Difference - Worksheet
Maths Resource Description
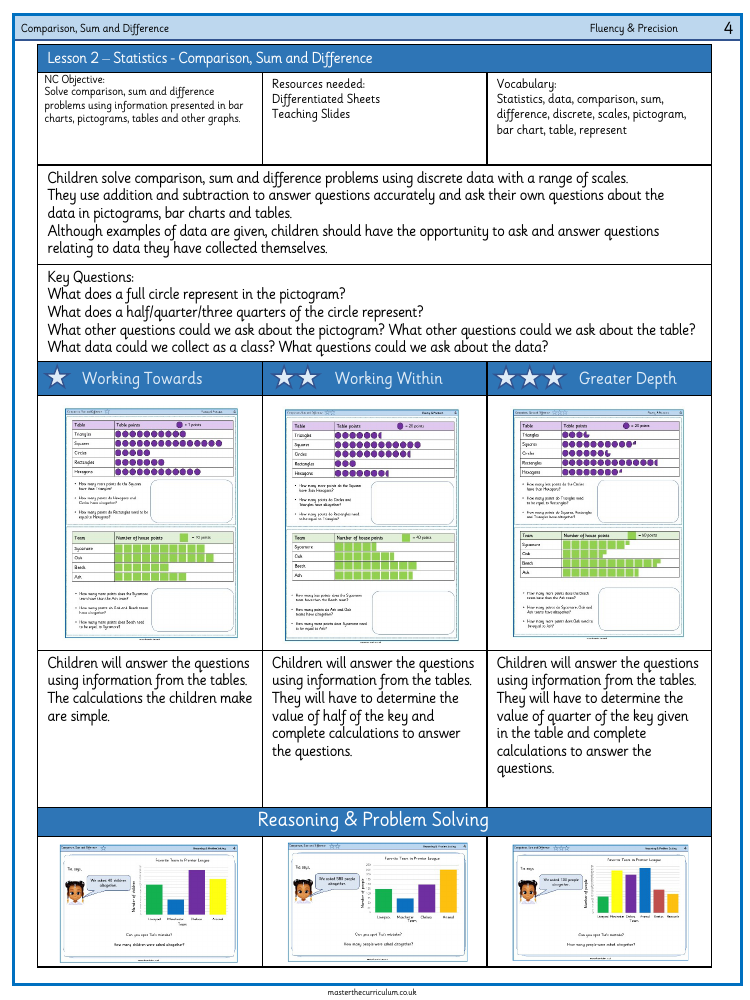
The lesson on 'Statistics - Comparison, Sum and Difference' is tailored for students to tackle mathematical problems using various forms of data presentation such as bar charts, pictograms, and tables. The National Curriculum objective is to solve comparison, sum, and difference problems using this information. To assist in the lesson, differentiated worksheets and teaching slides are provided as resources. Key vocabulary includes terms such as statistics, data, comparison, sum, difference, discrete, scales, pictogram, bar chart, table, and represent. Students are expected to use addition and subtraction to accurately answer questions about the data, as well as formulate their own queries related to the information they have gathered or been provided with.
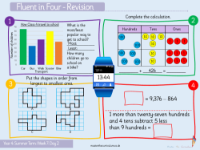
During the lesson, children are engaged in activities that require them to interpret data from tables and visual representations, such as determining the value of symbols in a pictogram and calculating the sum or difference in data points. They are encouraged to ask critical questions such as the meaning of full or partial symbols in pictograms, potential questions about tables, and suggestions for data collection as a class. The lesson aims to develop fluency and precision in handling statistical data, with a focus on reasoning and problem-solving skills. For instance, they may be asked to identify mistakes made in interpreting data, as demonstrated by the character Tia, who incorrectly reads the number of children's preferences for football teams from a bar chart. Overall, the lesson is designed to deepen students' understanding of statistics through practical and interactive tasks.
