Tally Charts Statistics - Worksheet
Maths Resource Description
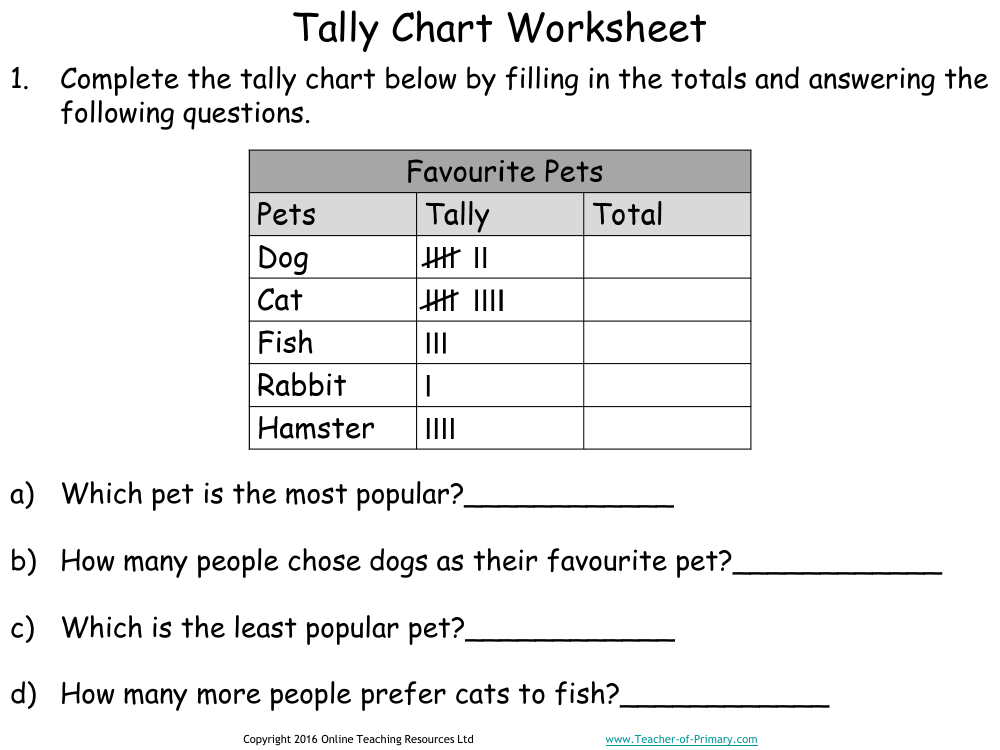
The Tally Chart Worksheet is a practical tool designed to help learners engage with the collection and analysis of data through observation. In one of the exercises, students are asked to complete a tally chart based on their favourite pets. They will fill in the totals for each category and answer questions to determine the most and least popular pets, the number of individuals favouring dogs, and the difference in preference between cats and fish. This exercise not only teaches children how to organise and interpret data but also encourages them to think critically about the popularity of different pets.
Another worksheet focuses on observing and recording the frequency of different coloured sheep. Students use a tally chart to keep track of their observations and then answer questions to identify the least and most common sheep colours, the numerical difference between blue and yellow sheep, the total number of sheep observed, and whether there were more black or white sheep. Additionally, a similar worksheet invites students to count and tally the colours of cars in a specific area, such as their street or school car park. They will then determine the most popular car colour and the total number of cars counted. These activities are designed to help Year 2 students develop their skills in statistics by collecting real-life data and drawing conclusions from their findings.